Chi Square Test[]
In general, the Chi Square Test is used in a variety of scientifc fields. However, the Chi Square Test has particular significance in the field of genetics. This test essentially enables researchers to determine whether or not two genes are linked. (And determine if the results were by chance or are legitimate representations of reality.)
Reasoning behing the Test
Researchers will form a testable hypothesis about the genes they would like to assess. The hypothesis will focus on whether or not independent assortment is observed in the progeny. If independent assortment is not observed, then the genes will be linked.
(Independent Assortment meaning that progeny can or cannot have any combination of the genes of interest. So if you are looking at pea plants and the independently inherited color and shape genes, you should see Yellow and Round peas, Yellow and Wrinkled peas, Green and Round peas and Green and Wrinkled peas in the progeny of two heterozygous Round and Yellow pea parents. Inversely, if you did not observe variation in the progeny, this would suggest that the genes are not independently assorted).
The hypothesis that is often made is that there is no linkage or independent assortment between the genes of interest. This hypothesis is the null hypothesis. From the Chi Square Test, researchers can then determine, whether or not they will need to reject their null hypothesis. In this case, the rejection of this hypothesis means that the there is in fact linkage between the two genes.
Math and an Example
Let's say that the researcher was looking at a dihybrid cross of Mendel's Pea Plants - ignoring that the results to this cross are well known. To assess whether pea color (yellow and green) and pea shape (round and wrinkled) are linked, the researcher develops the hypothesis that pea color is not linked to pea shape.
From here, the scientist selects 128 peas from a dihybrid cross of yellow and round peas. Assuming there is no linkage between the color and shape alleles, the researcher should expect that the progeny will be 72 Round and Yellow, 24 Round and Green, 24 Yellow and Wrinkled, and 8 Green and Wrinkled. (9:3:3:1 Ratio typical in independently assorted alleles). However he observes, 70 Round and Yellow, 26 Round and Green, 23 Yellow and Wrinkled, and 9 Green and Wrinkled.
He can then test his hypothesis using the Chi Square equation:

Pearson's chi-squared test. Wikipedia.
Where E are the expected values and O are the observed values.
For one of the phenotypes, the expected number of progeny is subtracted from the observed number of progeny and squared. This value is then divided by the expected number of progeny.
This is repeated for the different phenotypes and the resulting values are all added together to give a Chi Square Value (X^2).
Sample Math
Round and Yellow - ((70-72)^2)/ 70 = 0.057,
Round and Green - ((26-24)^2)/ 24 = 0.1667,
Wrinkled and Yellow - ((23-24)^2)/ 24 = 0.0417,
Wrinkled and Green - ((9-8)^2)/ 9 = 0.1111,
X^2 = 0.057 + 0.1667 + 0.0417 + 0.1111 = 0.3764
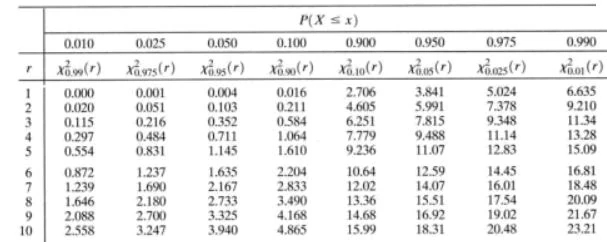
What does this number imply? To determine this, one may use a x^2 distribution chart as observed below. r stands for the degrees of freedom within the experiment,while P are the probability values. In general, degrees of freedom are the nondependent values within the experiment often equaling the number of variables minus one (df = n-1). So here the degree of freedom is 4-1 = 3.
The researcher would find the row corresponding to a degree of freedom of 3 and then find where the x^2 value is on that row (0.3674). By the looking at which columns this value is in (x^2 0.95 - x^2 0.90) the scientist will know the probability (95-90%) of the genes being independently assorted. If the probability had been less than 5% the hypothesis would need to be rejected, because it is at this point that the data results reflect a result by chance not one that is actually correct.
Chi Square Distribution Table. Penn State Stats 414/415 Website.https://onlinecourses.science.psu.edu/stat414/node/147
Thi's 'being the case and as we know from classical genetic experiments - Color and shape of peas are independently assorted and not linked!